User’s Guide
If you are restless, you can scroll down to the Jumbo Example section. Otherwise, here are the instructions:
Setup
This library requires Python 3.4-3.6. Assuming you already have Python 3 and pip installed, you can setup your project like this:
$ mkdir myproj
$ cd myproj
$ python3 -m venv myvenv
$ source myvenv/bin/activate
$ pip install diva
(you can check your version of Python 3 with python3 --version)
The command python3 -m venv myvenv creates a directory called myvenv to handle your project’s virtual environment. A virtual environment is a mechanism that gives the illusion (hence “virtual”) that your project’s version of the Python interpreter and any required libraries are installed locally. This isolates your project from other projects that may use different versions of Python (and thus different library versions). Virtual environments prevent conflicts of the form: Project A uses Python 2 and Project B uses Python3, and both depend on somelibrary, which is installed globally. Project A is broken because it thinks it should use the latest installed version of somelibrary, which only works for Python 3.
When you start working on your project, you must activate the environment with $ source myenv/bin/activate (which should prepend the environment name to your prompt like (myvenv) ... $), and you should deactivate it when you’re done using $ deactivate.
Introduction
Let’s start with a simple example. You’ll need to install diva and pandas from pip.
from diva import Diva
from diva.widgets import *
import pandas as pd

app = Diva()

@app.view('my sample view')
def foo():
    data = [p * 1.5 for p in range(20)]
    return pd.Series(data)

@app.view('my sample view with widgets', [
    Int('choose a size', 20),
    Float('choose a factor', 1.5)
])
def bar(size, factor):
    data = [p * factor for p in range(size)]
    return pd.Series(data)

app.run(debug=True)
You can run the example like:
$ python3 minimal_example.py
* Running on http://127.0.0.1:5000/ (Press Ctrl+C to quit)
...
Going to the given address in your browser should display:
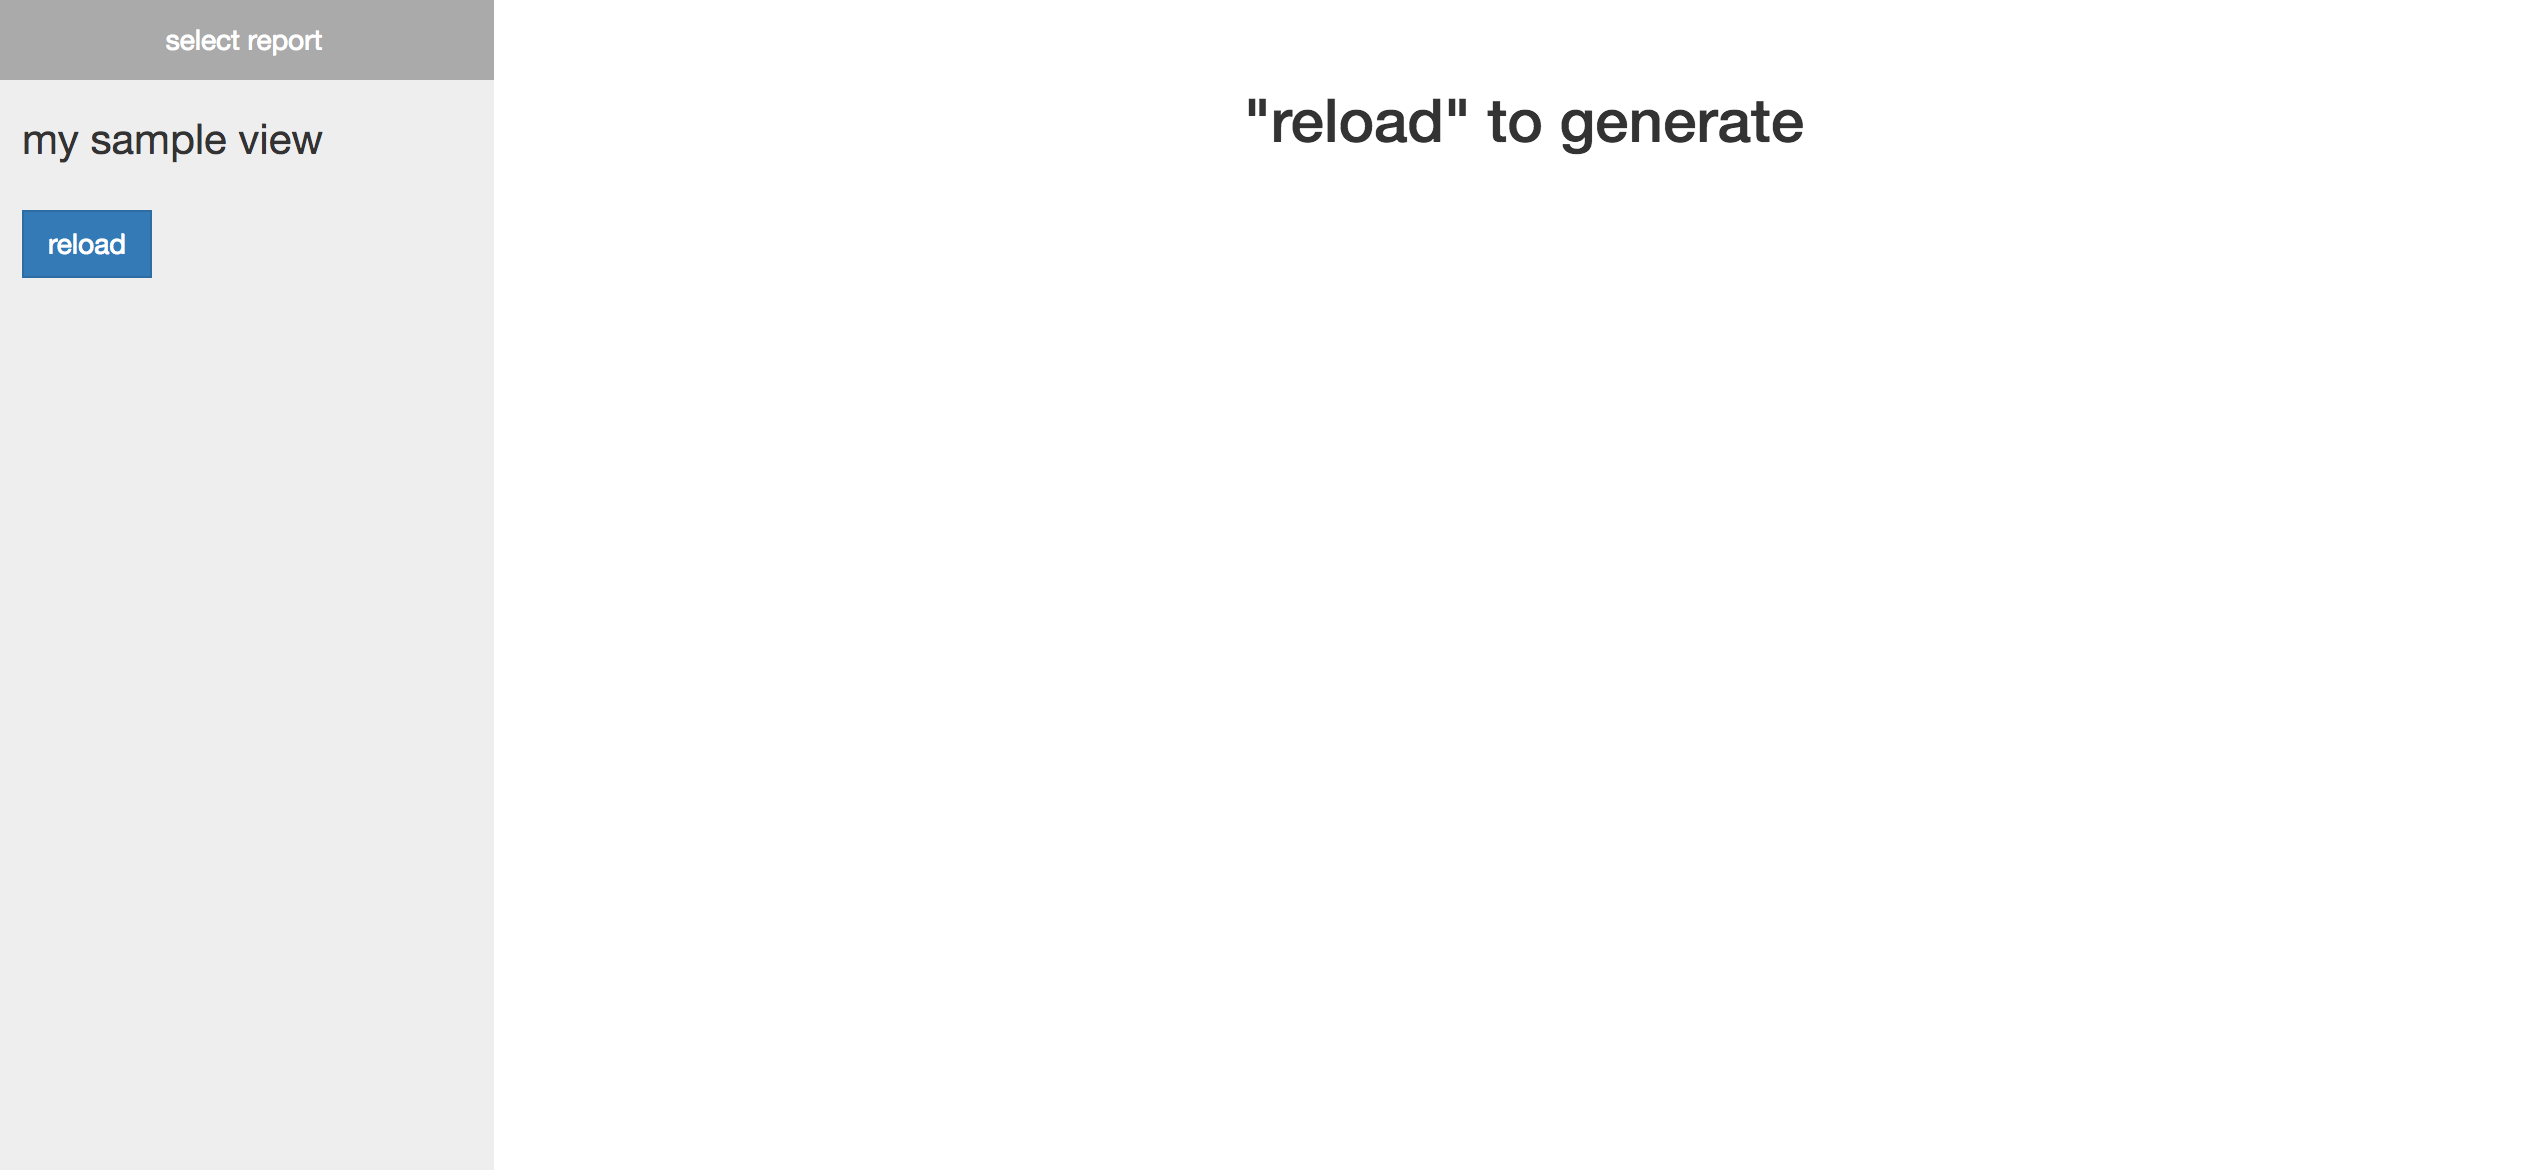
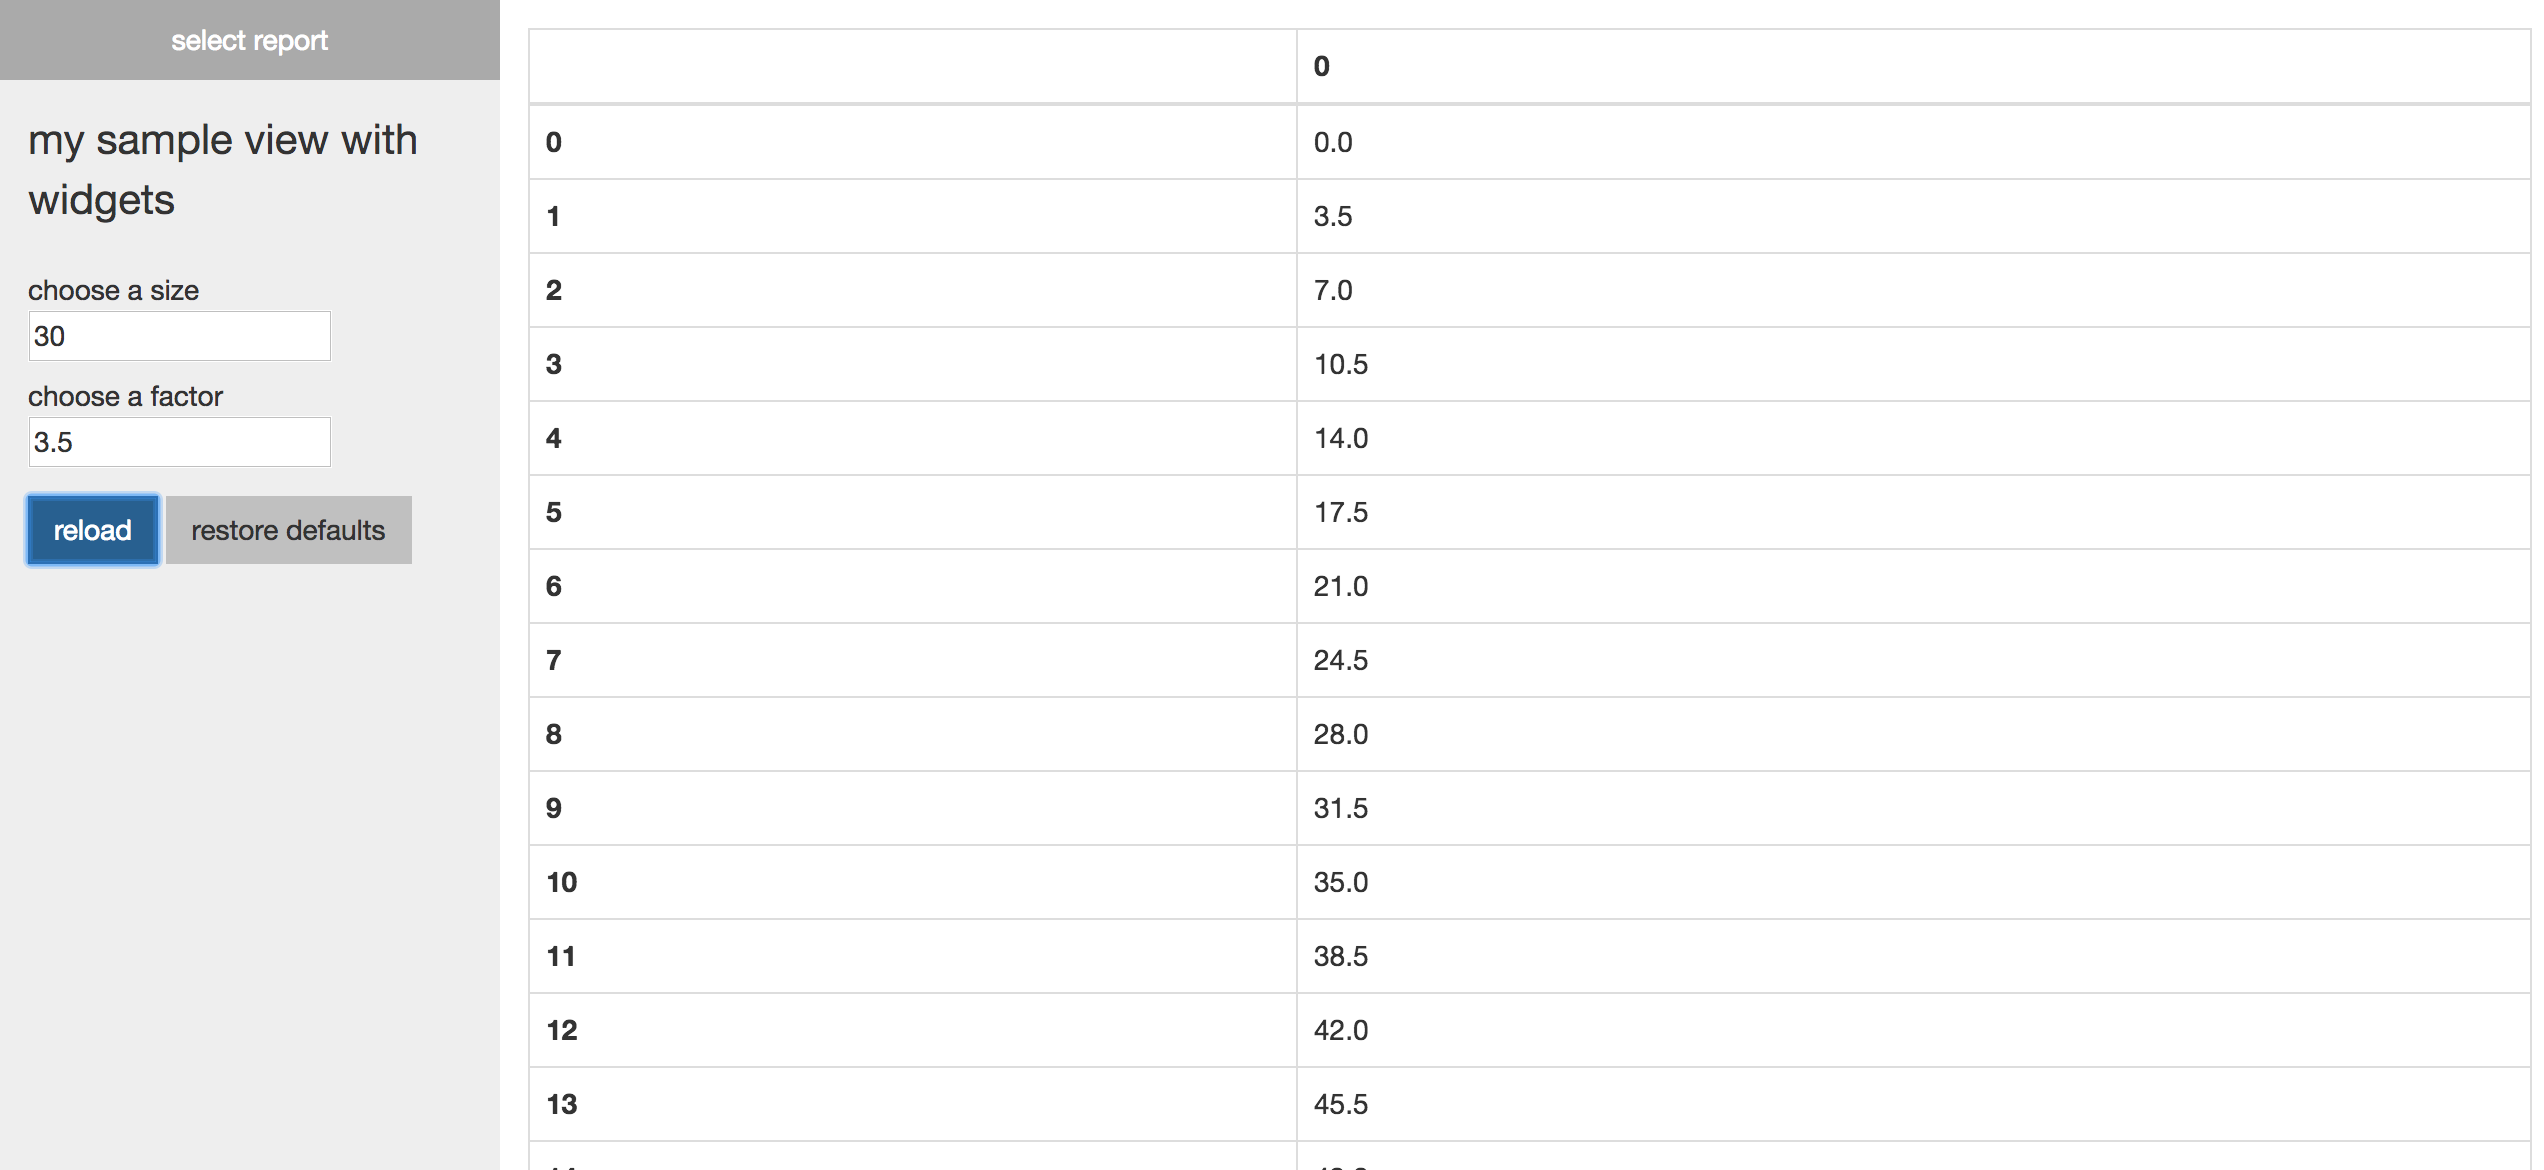
You should be able to change the report, and play with the widget values.
First, we create a Diva object. Next, we use python’s decorator syntax to register our analytics functions foo and bar with our Diva object. The view decorator does not modify the underlying function (view just stores a reference to it in the Diva object). You can call foo or bar elsewhere in your code as if you weren’t using diva at all. Finally, we call app.run(), which serves the website linked above. The site contains a report for every function we register with our Diva object.
You can pass a list of widgets to view. The bar function takes an integer and a float, so we pass the Int and Float objects to view. As you can see, the webserver generates appropriate HTML widgets. When we reload the bar report, the values of these widgets are sent to the server, passed to bar, and the result of bar is sent back to the browser (converted to HTML).
Basic API
-
Diva()¶ This internally creates
self.server, a Flask object, which is is started byrun. More complex uses of Diva may require directly modifying this Flask object.
-
Diva.view(name, widgets=[], short=None)¶ Meant to be used with decorator syntax.
nameis what the view will be called in the web interface.widgetsis an optionally empty list ofdiva.widgets.Widgetobjects.shortallows you to give a short name that you can use to refer to the report later (seecompose_view). It will be set tonameby default. Your decorated function is called like,your_func(*widget_values), wherewidget_valuesthe list of values of the given widgets. Please see the Widgets section for a list of available widgets and what values they pass to the underlying function.
-
Diva.compose_view(name, view_names, layout=None, short=None)¶ Creates a view by composing existing views.
nameis the name of the new view,view_namesis a list of names (itsshortname if one is given, otherwise its UIname) of the desired reports,layoutis a Dashboard layout (please see the Dashboard section), andshortis a short name to give to the newly created report (this works the same asshortfromview). Note that this function can only be called after you’ve registered all of the views named inview_names.
-
Diva.run(host=None, port=None, debug=None, **options)¶ runinternally looks like this:# self.server is a Flask object self.server.run(host, port, debug, **options)
Please see the Flask documentation for an explanation of
run’s arguments. Briefly, settingdebug=Truewill open an interactive debugger when an exception occurs, and also attempt to reload the server when the code changes.Warning
The interactive debugger allows one to run arbitrary Python code on your server, so don’t use
debug=Trueon a publically accessable site.Warning
If you want to make your diva app production ready, follow these steps to make the underlying Flask server production ready. Also see the Security section below.
-
Diva.__call__(environ, start_response)¶ This is likely only relevant to you if you’d like to deploy the server, in which case you should first read an article on WSGI servers and also refer to Flask’s documentation. The
Divaobject is callable as a WSGI entry point. This function passes the args to the Flask server’s (self.server) WSGI entry point and returns the result. Please see the source directorydiva/examples/demo_serverfor an example.
Widgets
The built-in widgets (available via from diva.widgets import *) are:
- String
- Float
- Int
- Bool
- SelectOne
- SelectSubset
- Color
- Slider
- Date
- DateRange
- Time
The first argument passed to every widget constructor is the description of the widget in the web interface (such as, “choose a scale”).
Converters
Diva attempts to convert the return value of your functions to HTML. The following conversions are supported:
- string: the string is assumed to be HTML.
- Dashboard: a diva.Dashboard object, see the Dashboard section below
- matplotlib.figure.Figure (using the mpld3 library)
- pandas.DataFrame & pandas.Series
- bokeh.plotting.figure.Figure
- other: the value is converted to a string and wrapped in HTML
Conversion internally uses the single dispatch decorator from functools, so you can add your own converter like this:
from diva import Diva
from diva.converters import convert_to_html
from datetime import date

@convert_to_html.register(date)
def my_converter(d):
    return '<p>year: {}, month: {}, day: {}</p>'.format(d.year, d.month, d.day)

app = Diva()

@app.view('my sample view')
def foo():
    return date(2017, 8, 11)

app.run()
Dashboards
The diva.Dashboard class and the diva.compose_view function allow you to create views that arrange plots, tables, etc. in a grid layout.
-
diva.Dashboard(convertable_list, layout=None):: convertable_listis a list of objects that can be converted to HTML (see the Converters section), such as[my_figure, my_table, my_custom_html](you can even include other Dashboard objects).layoutspecifies how the items are sized and positioned in the grid. The most convenient way to create a layout is withdiva.row_layout.
-
diva.row_layout(*num_columns):: The ith integer given is the number of items to place in row i. Returns a layout compatible with
Dashboardandcompose_view. Examples:row_layout(1, 1, 1)creates a 3-row layout where there is one item per row.row_layout(1, 2)creates a 2-row layout where there is one item in the first row and two items in the second row (placed side by side, with the row divided in half).
If row_layout is not enough, you can manually specify the layout argument. It is a list of [top_left_x, top_left_y, width, height] lists. For a 10 by 10 grid container, the top-left corner is (0, 0) and the bottom-right is (10, 10). For example, [0, 1, 2, 3] occupies the grid space from (0, 1) to (2, 4) on the grid. When giving your list of panes, you can imagine that your grid is any size you want. It doesn’t matter because it is scaled to fit its parent div in HTML. For example, layouts [[0, 0, 1, 1], [1, 0, 1, 1]] and [[0, 0, 2, 2], [2, 0, 2, 2]] both give a vertically split layout. The first one is not smaller than the second. Note that row_layout(2) returns this same layout.
from diva import Diva, Dashboard, row_layout
from diva.widgets import *
import pandas as pd
import numpy as np

app = Diva()

@app.view('convert: Dashboard')
def dashboard_view():
    a = pd.DataFrame(np.random.randn(10, 10))
    b = pd.DataFrame(np.random.randn(10, 10))
    c = pd.DataFrame(np.random.randn(10, 10))
    # will arrange the views such that a takes up the full first row
    # and the second row is split between b and c
    return Dashboard([a, b, c], row_layout(1, 2))

@app.view('convert: another Dashboard')
def dashboard_view():
    a = pd.DataFrame(np.random.randn(20, 5))
    b = pd.DataFrame(np.random.randn(10, 10))
    c = pd.DataFrame(np.random.randn(10, 10))
    # this uses a custom layout instead of row_layout
    # a will take up the left half of the view, and the right half
    # will be horizontally split, with b on top of c
    return Dashboard([a, b, c], [[0, 0, 1, 2], [1, 0, 1, 1], [1, 1, 1, 1]])

"""
You can create a dashboard view by composing existing views
"""

@app.view('view a', [Int('enter num', 5)])
def view_a(foo):
    return pd.Series([foo for i in range(10)])

@app.view('some very long and tedious name', [String('enter name', 'foo')], short='view b')
def view_b(bar):
    return pd.DataFrame([bar for i in range(10)])

# provide a list of the names of the views you want to compose.
# If a short name is provided for the view, you must use that name
app.compose_view('composed view', ['view a', 'view b'], row_layout(2))

app.run(debug=True)
Utilities
Depending on the type that your function returns, utility buttons may be added to the sidebar. If your view function returns a pandas DataFrame, for example, a button will appear in the widgets sidebar allowing you to export it to a .csv file. You can add utilities like this:
from diva import Diva
from diva.widgets import *
from diva.utilities import register_simple_util, register_widget_util, file_response
import pandas as pd
import tempfile

# if your utility has options that depend on the currently displayed value,
# of the figure, then use register_widget_util

def my_util_widgets(val):
    """
    Allow the user to select which of the table's columns to export
    """
    column_names = [str(name) for name in list(val)]
    return [SelectSubset('select the columns you want', column_names)]

def my_util_apply(val, chosen_columns):
    """
    Export only the selected columns to csv
    """
    # convert the subset to a list of bools, with True for cols to include
    # and False ow
    all_col_names = [str(name) for name in list(val)]
    col_bools = [e in chosen_columns for e in all_col_names]
    my_file = tempfile.NamedTemporaryFile()
    val.to_csv(my_file.name, columns=col_bools)
    return file_response('your_file.csv', my_file.name)

register_widget_util('export columns', pd.DataFrame, my_util_widgets, my_util_apply)

# if, on the other hand, your utility does not depend on the currently displayed
# value, you can use register_simple_util, which is a wrapper around the above method
@register_simple_util('export with separator', pd.DataFrame, [String('enter a separator', ',')])
def another_util_apply(val, sep):
    my_file = tempfile.NamedTemporaryFile()
    val.to_csv(my_file.name, sep=sep)
    return file_response('your_file.csv', my_file.name)

app = Diva()

@app.view('my sample view')
def foo():
    return pd.DataFrame({'a': [1, 2], 'b': [3, 4], 'c': [5, 6]})

app.run()
As shown in the example, utilities must return the result of a call to file_response. This triggers a file download on the client side.
Splitting into multiple files
You split your project into multiple files using the extend function:
Here is an example, where foo.py, bar.py, and main.py are in the same directory:
foo.py
from diva import Diva
app = Diva()

@app.view('foo')
def foo():
    return [1, 2, 3]

if __name__ == '__main__':
    app.run(debug=True)
bar.py
from diva import Diva

app = Diva()

@app.view('bar')
def bar():
    return [4, 5, 6]

@app.view('bar_2')
def bar_2():
    return [7, 8, 9]

if __name__ == '__main__':
    app.run(debug=True)
main.py
from diva import Diva
from foo import app as foo_app
from bar import app as bar_app

app = Diva()

# adds all of the views from foo_app and bar_app
# to this app
app.extend(foo_app)
app.extend(bar_app)

app.run(debug=True)
To show all views, run python3 main.py. If you want to focus your work on the views in foo.py,
just run python3 foo.py.
Security
Input Sanitation
If you are allowing public access to your site, you are responsible for sanitizing user input. Diva performs some trivial sanitation, like ensuring the value of a string widget is actually passed to your function as a string and not an int. However, if your underlying functions are accessing sensitive information, take heed.
Password Protection
Diva currently doesn’t support password management. It may support simple password protection in the future, but likely not a full user access system.
However, you can modify the underlying Flask object to add your authentication code like this:
app = Diva()

# create some views like normal

flask_server = app.server

# Modify flask_server to add your auth code

# this is the same as flask_server.run()
app.run()
You can modify the Flask object’s view functions (docs here) to add your auth code. See the function setup_server from the diva source file diva/diva/reporter.py to see what endpoints diva uses.
More Examples
You can find many examples in the diva/examples folder on Github.
Jumbo Example
from diva import Diva, Dashboard, row_layout
from diva.widgets import *
# only required if adding your own converter:
from diva.converters import convert_to_html

import numpy as np
import pandas as pd
from bokeh.plotting import figure
from datetime import *

app = Diva()

"""
No Widgets
Reloading will always give the same figure
"""
@app.view('no widgets')
def no_widgets():
    return pd.Series([x for x in range(20)])

"""
Simple Widgets
Reloading passes the values of the widgets to the func
"""
@app.view('simple widgets', [String('enter name'), Int('enter age')])
def simple_widgets(name, age):
    return name, age

"""
Many widgets
"""
@app.view('many widgets', [
    String('some text'),
    Float('a float'),
    Int('an int'),
    Bool('a bool'),
    SelectOne('choose one', ['a', 'b', 'c']),
    SelectSubset('select many', ['foo', 'baz', 'baz'], ['foo']),
    Color('pick a color'),
    Slider('a float'),
    Date('a date'),
    Time('a time'),
    DateRange('a date range')
])
def many_widgets(*widget_values):
    return widget_values

"""
Date Widgets
There are many ways to specify the defaults, see the docs for details
"""
@app.view('date widgets', [
    # this defaults to: the exact date in ISO format
    Date('date a', '2017-08-21'),
    # defaults to: 7 days ago
    Date('date b', relativedelta(weeks=1)),
    # defaults to: the range between the exact dates in ISO format
    DateRange('range a', '2017-08-21', '2017-08-26'),
    # you can also use relative dates
    # defaults to: the last week
    DateRange('range b', relativedelta(days=7), relativedelta()),
    # or a combination of exact and relative
    # defaults to: exact date to present
    DateRange('range c', '2017-07-15', relativedelta())
])
def date_widgets(date_a, date_b, range_a, range_b, range_c):
    return date_a, date_b, range_a, range_b, range_c

"""
Converter Examples:
An example of using each type that can be converted to HTML
is given.
See the matplotlib example for the matplotlib.figure.Figure converter
"""

"""
A string is assumed to be raw HTML
"""
@app.view('convert: str')
def raw_html():
    return '<h1>Raw HTML</h1><p>If a string is returned, it is assumed to be raw HTML</p>'

@app.view('convert: pandas.DataFrame')
def pandas_df():
    df = pd.DataFrame(np.random.randn(20, 20))
    return df;

@app.view('convert: pandas.Series')
def pandas_series():
    s = pd.Series([p for p in range(100)])
    return s

@app.view('convert: bokeh.plotting.figure.Figure')
def bokeh_fig():
    x = [1, 2, 3, 4, 5]
    y = [6, 7, 2, 4, 5]
    plot = figure(title="bokeh example", x_axis_label='x', y_axis_label='y')
    plot.line(x, y, legend="Temp", line_width=2)
    return plot

"""
If Diva does not support the type, it's string representation is
converted to HTML
"""
@app.view('convert: none of the above (ex. array of ints)')
def na():
    return [i for i in range(10)]

@app.view('convert: Dashboard')
def dashboard_view():
    a = pd.DataFrame(np.random.randn(10, 10))
    b = pd.DataFrame(np.random.randn(10, 10))
    c = pd.DataFrame(np.random.randn(10, 10))
    # will arrange the views such that a takes up the full first row
    # and the second row is split between b and c
    return Dashboard([a, b, c], row_layout(1, 2))

@app.view('convert: another Dashboard')
def dashboard_view():
    a = pd.DataFrame(np.random.randn(20, 5))
    b = pd.DataFrame(np.random.randn(10, 10))
    c = pd.DataFrame(np.random.randn(10, 10))
    # this uses a custom layout instead of row_layout
    # a will take up the left half of the view, and the right half
    # will be horizontally split, with b on top of c
    return Dashboard([a, b, c], [[0, 0, 1, 2], [1, 0, 1, 1], [1, 1, 1, 1]])

"""
You can create a dashboard view by composing existing views
"""

@app.view('view a', [Int('enter num', 5)])
def view_a(foo):
    return pd.Series([foo for i in range(10)])

@app.view('some very long and tedious name', [String('enter name', 'foo')], short='view b')
def view_b(bar):
    return pd.DataFrame([bar for i in range(10)])

# provide a list of the names of the views you want to compose.
# If a short name is provided for the view, you must use that name
app.compose_view('composed view', ['view a', 'view b'], row_layout(2))

"""
Register a new converter.
Now if you register a view that returns a datetime.date object, it will
return the HTML from this function
"""
@convert_to_html.register(date)
def my_converter(d):
    return '<p>year: {}, month: {}, day: {}</p>'.format(d.year, d.month, d.day)

@app.view('my sample view')
def foo():
    # this will use the new converter
    return date(2017, 8, 11)

# Setting debug=True will allow live code reload and display a debugger (via Flask)
# if an exception is thrown.
app.run(debug=True)
matplotlib examples:
# You should use the 'Agg' backend (for PNGs) when importing matplotlib
# b/c otherwise a matplotlib will attempt to open a GUI app
import matplotlib
matplotlib.use('Agg')
import matplotlib.pyplot as plt
import numpy as np
import pandas as pd
from diva import Diva, Dashboard
from diva.widgets import *

"""
As shown, you should use the object-oriented matplotlib functions.
Otherwise, two different functions may unintentionally be modifying
the axes of the same figure, which can cause confusion.

Since matplotlib maintains internal references to all figures you create,
they will not actually be garbage collected until you explicitly close them!
This is not shown here b/c I intend to make some kind of workaround,
something like:
https://stackoverflow.com/questions/16334588/create-a-figure-that-is-reference-counted/16337909#16337909

These examples are adapted from:
https://matplotlib.org/users/pyplot_tutorial.html
"""

app = Diva()

@app.view('simple figure', [Int('x', 3)])
def matplot_fig(x):
    # make a new figure
    fig, ax = plt.subplots()
    ax.plot([3,1,4,1,x], 'ks-', mec='w', mew=5, ms=20)
    return fig

"""
There is some subtle error here. Only updates upon
increasing x
May have to do with overwriting fig 1?
"""
@app.view('subplots', [Float('x', 5.0)])
def subplots(x):
    def f(t):
        return np.exp(-t) * np.cos(2*np.pi*t)

    t1 = np.arange(0.0, x, 0.1)
    t2 = np.arange(0.0, x, 0.02)

    # Use the object-oriented matplotlib functions
    # for subplots,
    fig, axes = plt.subplots(2, 1)
    axes[0].plot(t1, f(t1), 'bo', t2, f(t2), 'k')
    axes[1].plot(t2, np.cos(2*np.pi*t2), 'r--')

    return fig

@app.view('matplotlib mutliple figures')
def multiple_figures():
    fig_a, ax_a = plt.subplots()
    ax_a.plot([1, 2, 3, 4, 5], 'ks-', mec='w', mew=5, ms=20)
    fig_b, ax_b = plt.subplots()
    ax_b.plot([6, 7, 8, 9, 10], 'ks-', mec='w', mew=5, ms=20)
    return Dashboard([fig_a, fig_b])

@app.view('matplotlib larger figure', [Int('x', 3)])
def matplot_fig(x):
    fig_a, ax_a = plt.subplots(figsize=(4, 4))
    ax_a.plot([1, 2, 3, 4, 5], 'ks-', mec='w', mew=5, ms=20)
    # figsize allows you to set the size of the figure in inches
    fig_b, ax_b = plt.subplots(figsize=(8, 8))
    ax_b.plot([6, 7, 8, 9, 10], 'ks-', mec='w', mew=5, ms=20)
    return Dashboard([fig_a, fig_b])

app.run(debug=True)
kwargs example:
If your function takes **kwargs, you must suffer this mild inconvenience:
def baz(a, b, *args, **kwargs):
    return '<p>{} {} {} {}</p>'.format(a, b, args, kwargs)
@app.view('shim example', [
    Int('choose an int'),
    Float('choose a float'),
    String('choose a string'),
    Bool('choose a bool')])
def baz_shim(my_int, my_float, my_str, my_bool):
    # in baz: a=my_int, b=my_float, args=(my_str), kwargs={'hi': my_bool}
    return baz(my_int, my_float, my_str, hi=my_bool)
Alternatives
Jupyter has its own widget library, and you can interact with functions like this. To share a Jupyter notebook, you can archive the .ipynb file in your GitHub, then use the tools nbviewer or mybinder to give others access to your notebook. You can also take a look at IPython Dashboards.